Trusted by industry-leading brands

Awards
A top-ranking platform


Benefits
Free yourself from data drudgery with our intelligent reporting solution
Get a comprehensive view of your financials through customizable reports, dynamic visualizations, and flexible KPI tracking – all in one intuitive system. Seamlessly integrate with Excel and your favorite BI tools, while maintaining full control to make adjustments on the fly.
Comprehensive view
Get instant access to standard and ad-hoc reports with rich visualizations, comparative analytics, and multi-currency capabilities – all tailored to your needs.
Flexibility
Easily modify structures, add KPIs, and track statistics in one transparent system that adapts to your evolving business requirements.
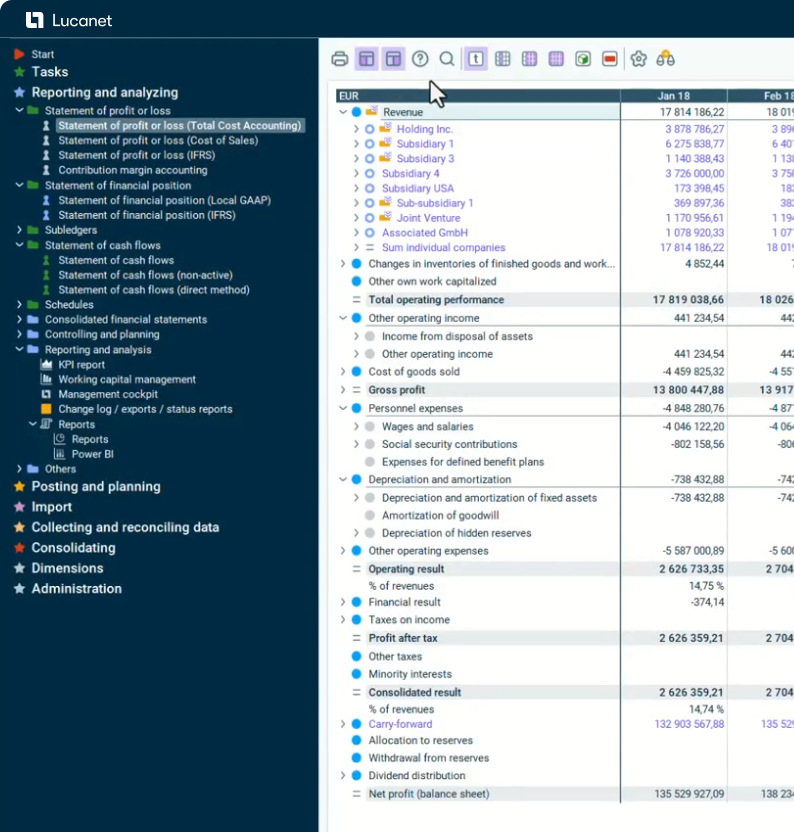
Excel integration
Seamlessly connect with Excel for interactive data analysis and automated report generation through our powerful Excel Add-In.
BI integration
Connect your preferred BI tools – including Tableau, QlikView, and Power BI – to create insights and visualizations leveraging a single source of data across your entire analytics ecosystem.
Time savings
Eliminate manual data tasks and shift your focus to strategic analysis that drives business value.
Self-service software solution
Take control of your reporting with intuitive self-service tools that reduce IT dependency and empower your finance team.

Key features
Management reporting made simple with Lucanet
-
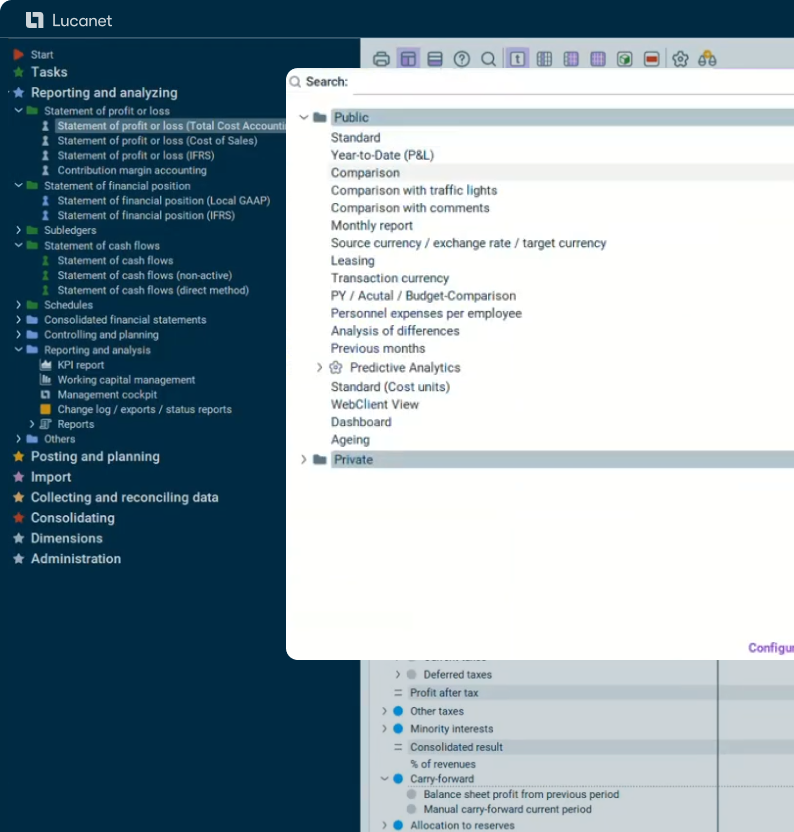
Push-button reports
-
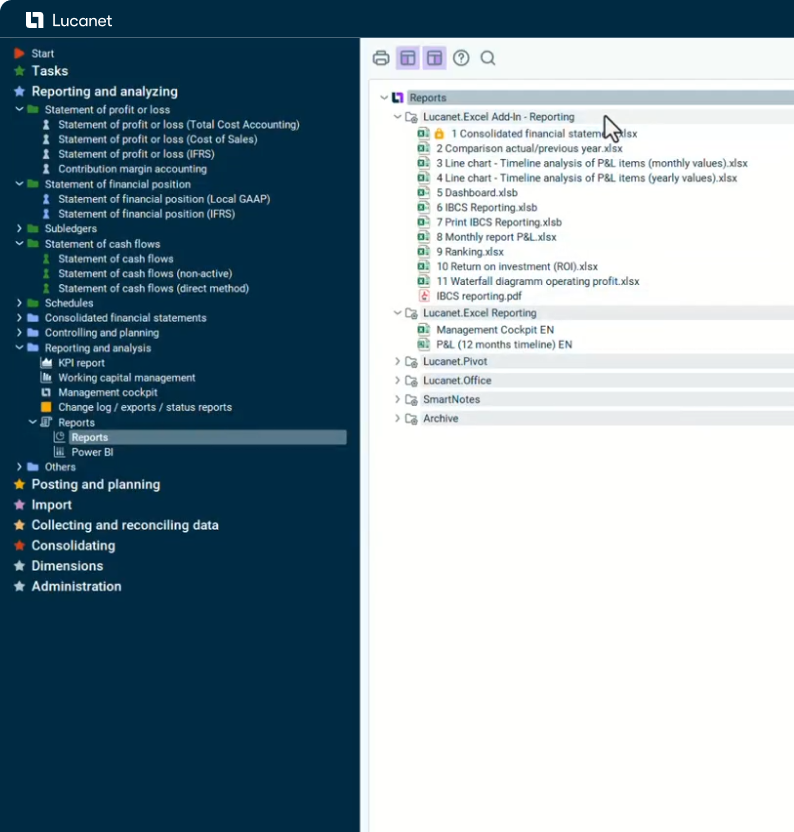
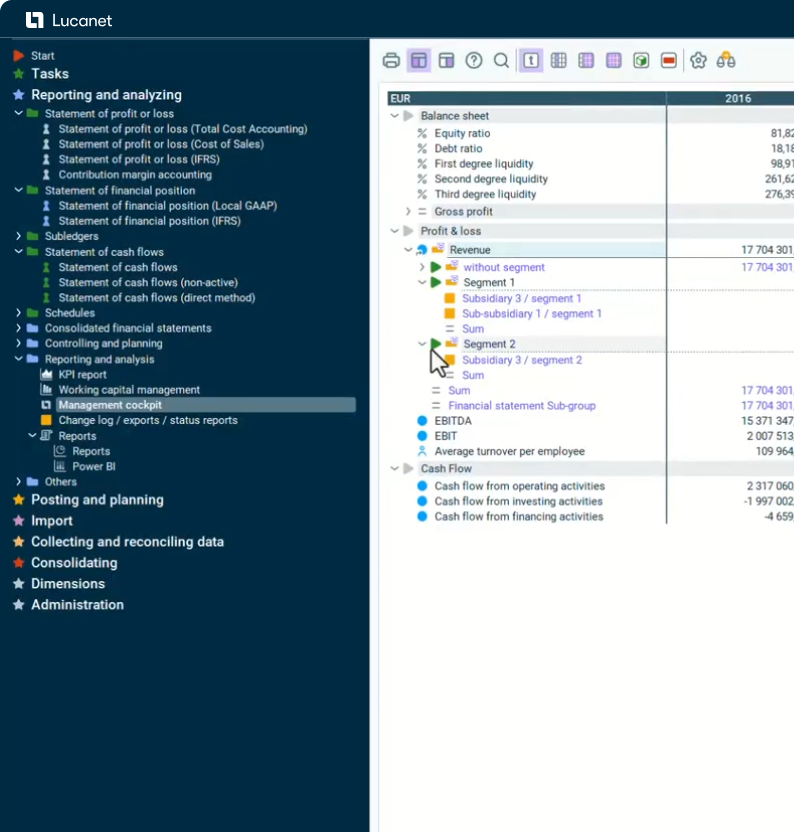
Management cockpit visualization
-
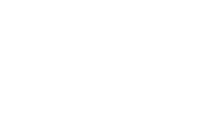
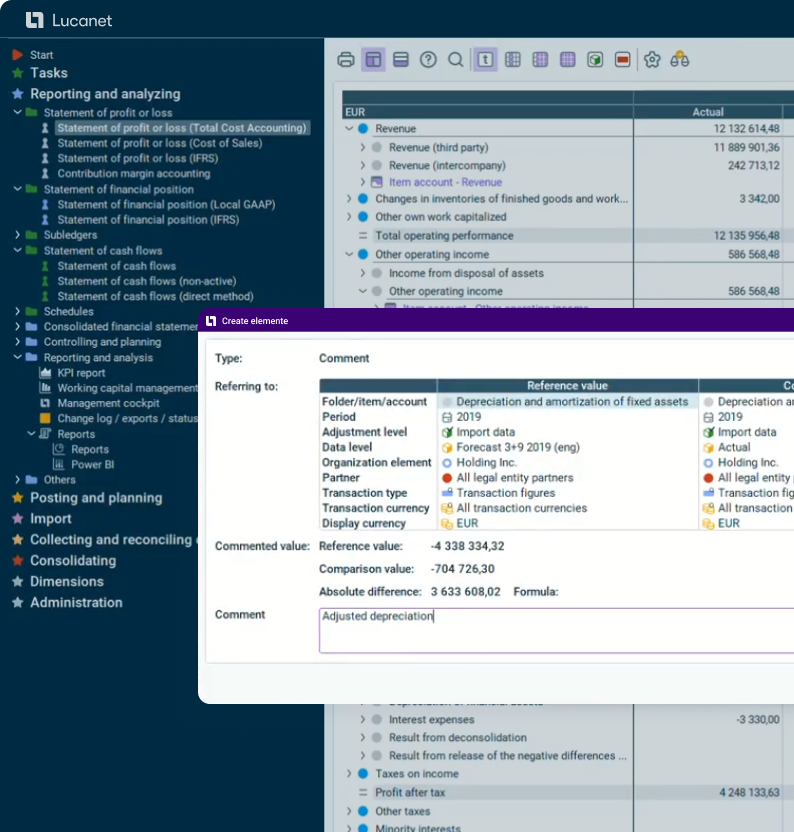
P&L statement with any details over time in the drill-down of the group structure
-
Comparison view (actual-planning-forecast) with commenting function
-
Comparison view (actual-planning) with traffic light function and graphic
-
Management cockpit with indicators and drill-down to segment level


Faster, more reliable consolidation every month
Enhanced
global performance
visibility for finance directors
Tailor
reports to specific needs
Use cases

One tool for all financial data
Less
manual work
High data
quality
More time
for analyzing figures
Use cases

Full transparency of financial data
Transparency
Monthly reporting
Use cases

certifications
Technical and security information
By using recognized industry standards, Lucanet ensures the protection of company, customer and partner information.