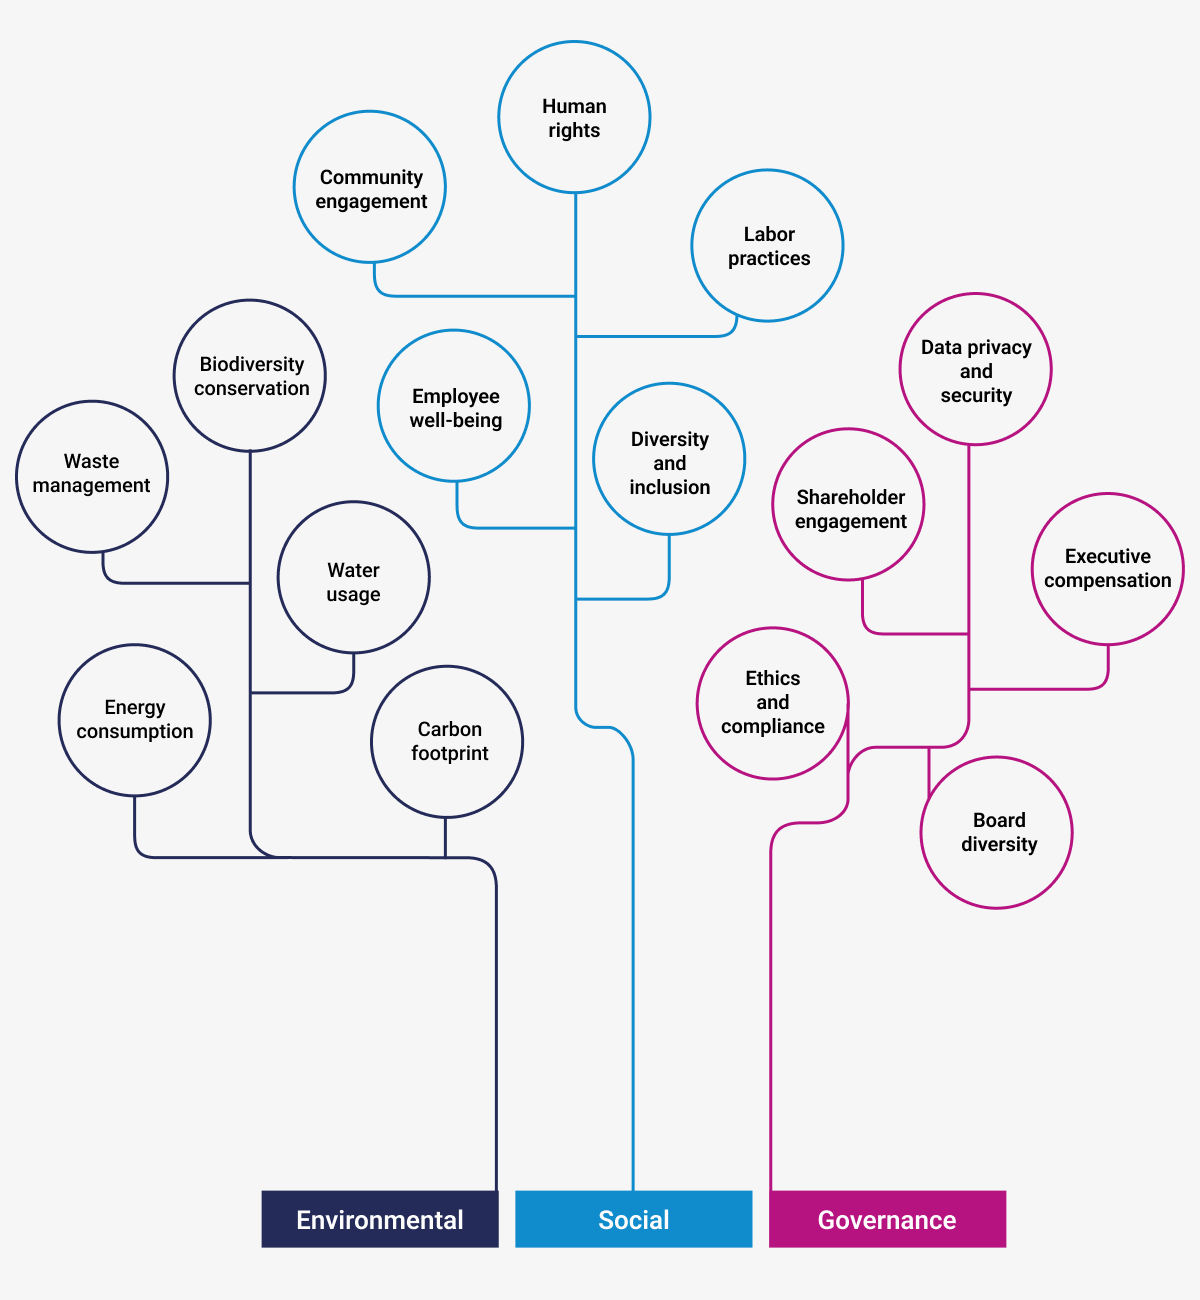
Here we’ve made a simple split into E, S, and G drivers but of course depending on the number of disclosure requirements you would likely want to split it into further subcategories. This will enable you to create a more comprehensive value driver tree.
The next challenge is to create comparable metrics which will allow you to consolidate the results to one level up like the price X volume = revenue example. There’s a simple X step process to do it.
- Decide how to measure each of the selected metrics
- Assign a performance range to each metric
- Recalculate the data point of the metric into a 1-5 or 1-10 scale
- Consolidate all metrics as an average to the higher level metric
This will allow you to calculate a comparable score at each level of your driver tree and finally calculate an ESG score. Your score won’t be comparable to other companies of course since there’s no defined standard for this. However, you can use it for internal comparison purposes as well as to improve performance in absolute terms. After all, it will be easy to see which metrics are dragging down your overall score.
It doesn’t remove the general challenge of finding ways to report all these metrics, however, it suddenly increases the relevance of doing so significantly. Now you have a tool where you can measure your performance and have data-driven discussions about how to improve it.
Linking ESG data to financials
This may be the most challenging task for finance professionals to do. That’s because we often struggle to recalculate process metrics (or any non-financial metric) into financial values. It can be done though. Let’s consider a few examples.
- Carbon footprint can be recalculated into CO2 emission credits
- Energy and water consumption has a direct cost
- Employee engagement can be related to staff turnover which has a direct cost
- Labor practices can be linked to ability to attract talent which has a direct cost
- Data security can be linked to amount of breaches which has a direct cost
All metrics are perhaps not as easy to quantify in financials, however, similar processes could be established to measure the financial impact of your ESG KPIs. It’s important to say that ESG shouldn’t only be measured in financials. Businesses will still be required to deliver acceptable returns going forward hence this remains an important process.
How CFOs pick the right ESG KPIs
This leads us to the main question of the blog. What are the most important ESG KPIs for CFOs and how to pick them. Unfortunately, there’s no shortcuts to doing this. You’ll have to thoroughly review the double materiality principle of your business activities on the environment, economy, and society and how these have significant effects on your business.
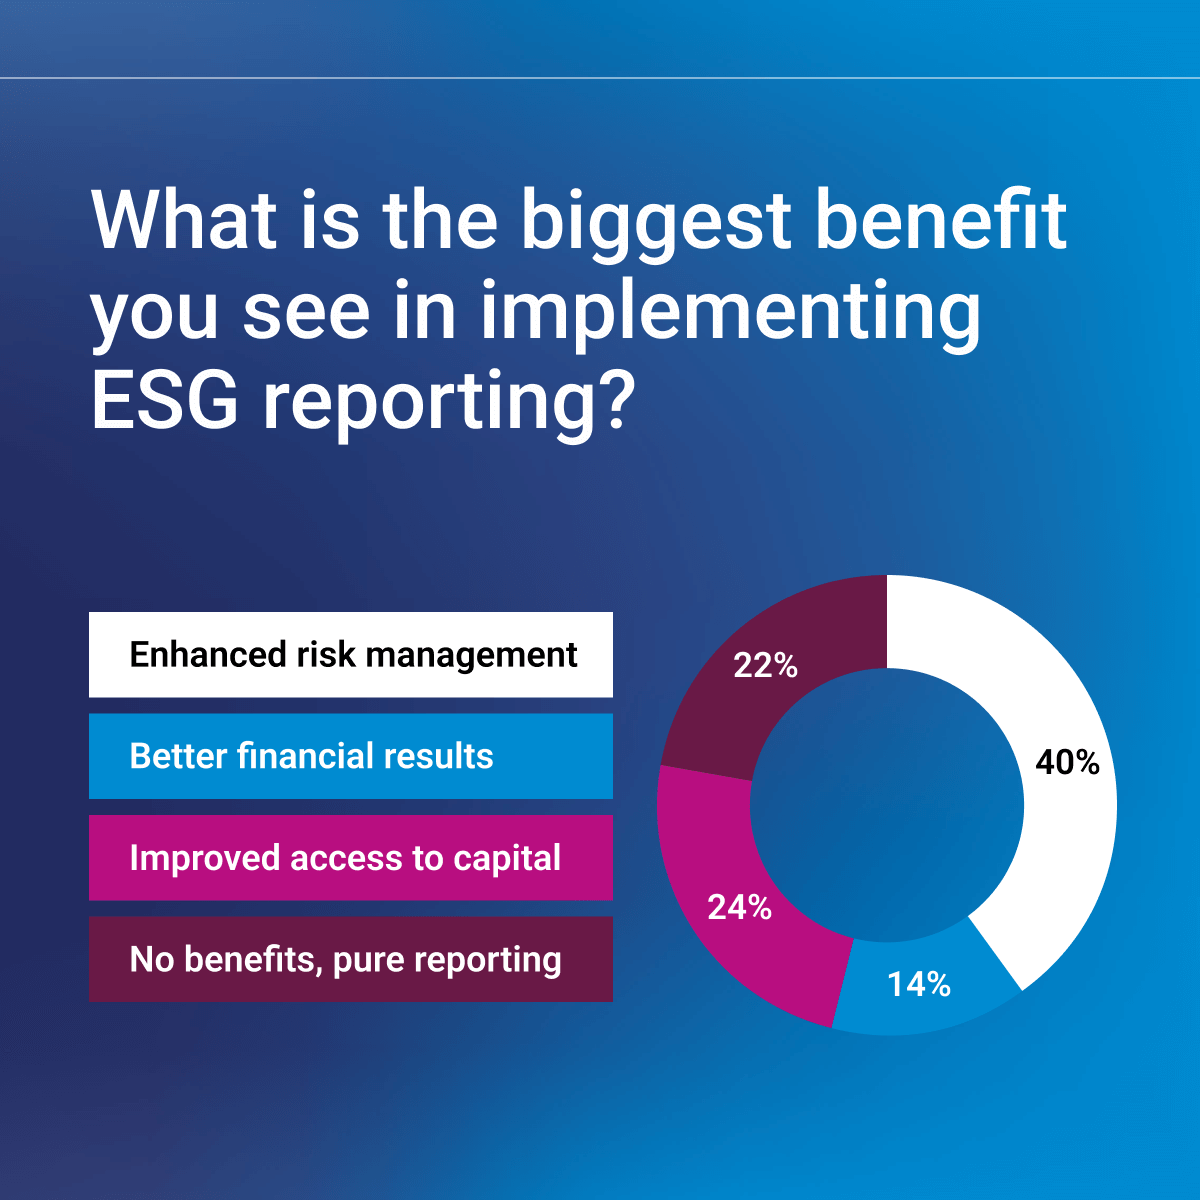
This is a collaborative effort involving most departments but could be facilitated by specialists in the finance team who can both ask challenging questions but also ensure the completeness of the topics covered as it relates to disclosure requirements. It’s very likely you’ll need to pull on outside experts as well. Hence, as this is a process each company must run with potentially different outcomes there’s also no one right list of ESG KPIs for all companies. It’s also highly likely that once you have gone through the first selection round and start measuring that you learn something new. That makes it an iterative process. It’s quite certain though that you’ll see significant benefits. In a recent poll we did 78% of finance professionals said they expected tangible benefits from their ESG reporting.


